Dokku will tell you an app deployed. It won’t tell you it has been returning 502s since Tuesday.
That’s the trade you make for git push deploys on a single server: you get Heroku’s workflow without Heroku’s dashboards. dokku logs shows recent output from an app’s running containers and docker stats shows this second’s resource use, but neither gives you a durable, searchable history that survives redeploys. I wanted one screen that answered “is the server okay?” and another that answered “is this app okay?”, running on the same host, with the collectors and their storage kept off the internet. Grafana would be the one new public endpoint, served through Dokku like any other app.
So I added an observability role to ansible-server-bootstrap, the playbook from the previous post. This is the Server dashboard it provisions as Grafana’s home page:
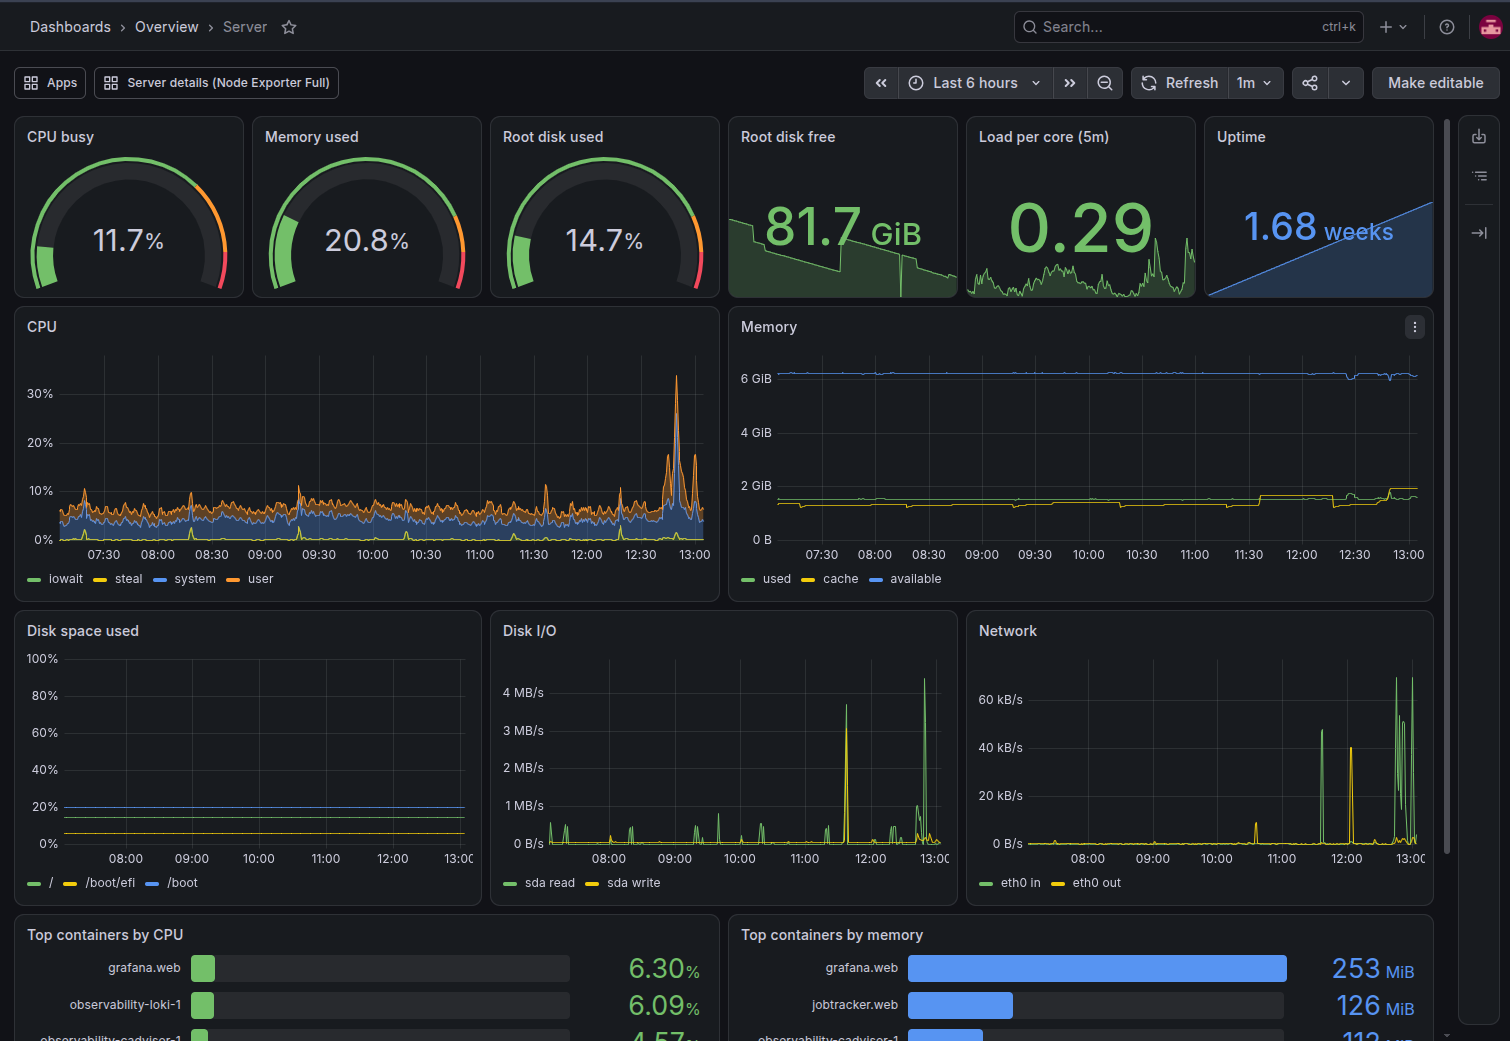
That’s a host running two apps and the whole monitoring stack. The gauges show the latest reading when I took the screenshot, 11.7% CPU and 20.8% memory, with six hours of history in the graphs below them. The uncomfortable part is at the bottom of the same dashboard:
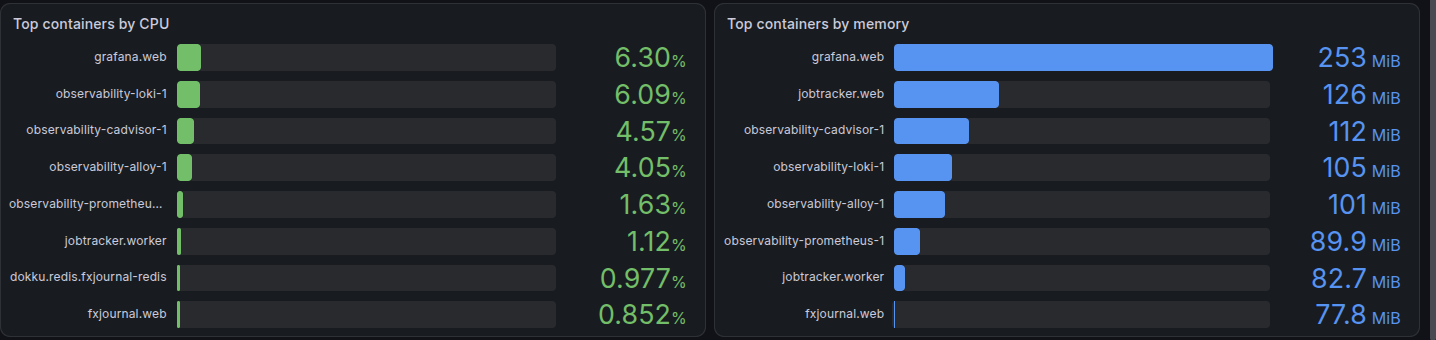
On this host, with its current light workload, the monitoring is heavier than the things it monitors. These panels are a snapshot at the moment of the screenshot, with CPU measured as a rate over a short recent window. At that moment Grafana used 253 MiB, twice the busiest app (jobtracker.web, 126 MiB), and the five largest monitoring containers added up to about 660 MiB and just under a quarter of a CPU core, while the apps together used under 0.04 of a core. Busier apps would change the ratio, but on a small server that overhead is a real cost, and it’s worth knowing before you copy this setup. Most of the interesting work wasn’t the Prometheus config. It was fitting the stack around the way Dokku handles containers, nginx and ports.
Two kinds of service
The stack is seven services: Prometheus, Loki, Alloy (log shipping), node-exporter (host metrics), cAdvisor (container metrics), blackbox-exporter (health checks) and Grafana. The first decision was where each one runs, and the rule that fell out was simple: does it serve the public?
The six collectors don’t, and they need things Dokku apps aren’t built for: host mounts, the host PID namespace, the Docker socket, and in cAdvisor’s case privileged mode. They run as a plain Compose project in /opt/observability.
Grafana does serve the public. It needs a domain, an nginx vhost and a TLS certificate, which Dokku already does for every other app. So Grafana is deployed as a Dokku app, and gets its HTTPS the same way as any other Dokku app.
It’s worth being blunt about the cost of the collectors. Prometheus, Alloy and cAdvisor can all read the Docker socket, and cAdvisor runs privileged, so all three are effectively root. Keeping them off the public internet, which the next section covers, reduces the exposure, but it isn’t a justification on its own. Any app attached to the observability network can reach Prometheus, Loki and the exporters directly, and none of them require authentication. I accept that trust boundary because every app on this host is mine. On a server running code you don’t fully trust, you’d want separate networks or authentication in front of those services.
Keeping the exporters off the internet
Everything shares one Docker network, observability. Ansible creates it, not Compose, and the Compose file marks it external. Dokku apps join it with dokku network:set <app> attach-post-deploy observability, and if Compose owned the network, docker compose down would try to delete it from under them.
node-exporter was the awkward one. It needs host networking, or it reports the container’s network interfaces instead of the server’s. But host networking with its default listen address means port 9100 on the public interface. The fix is to listen only on the Docker network’s gateway address, which is the host’s side of the bridge:
node-exporter:
  command:
    - --path.rootfs=/host
    - --web.listen-address=172.30.0.1:9100
  network_mode: host
  pid: host
Then Prometheus couldn’t reach it either. Traffic from a container to the host’s own address goes through the host’s INPUT chain, and ufw denies it by default. This is the opposite of the famous “Docker bypasses ufw” problem, and it needs exactly one rule: allow 172.30.0.0/24 to reach 172.30.0.1 on 9100.
Nothing else in the stack publishes a port.
Every panel from things Dokku already has
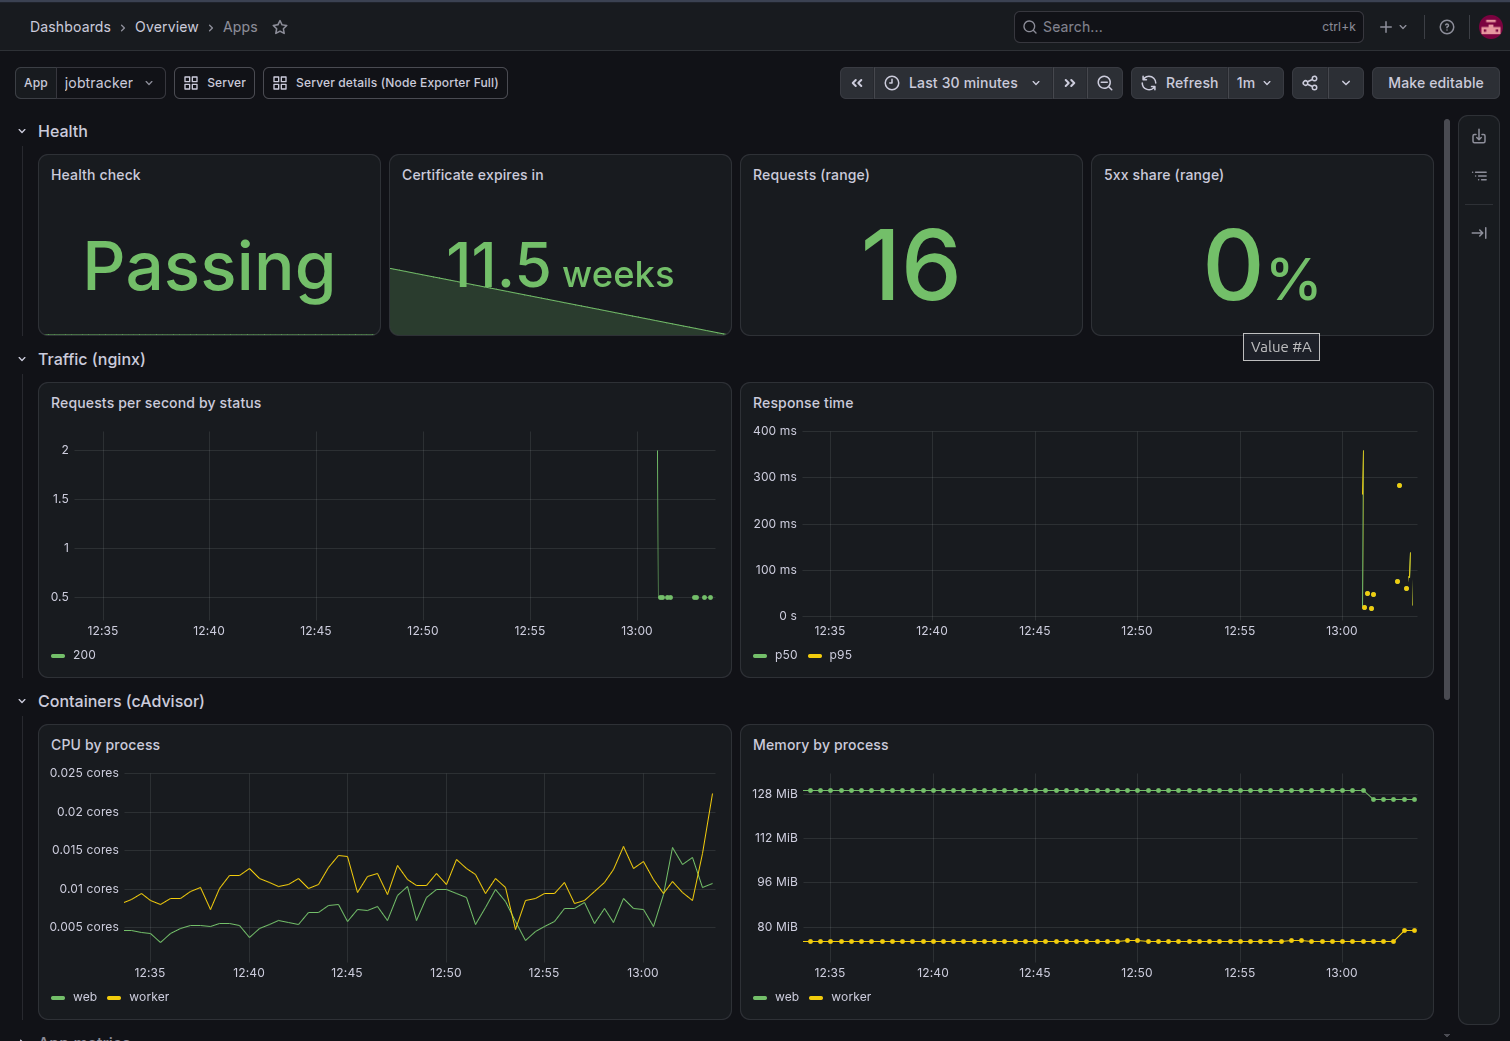
The per-app dashboard needed to work for any app with as little from the app as possible:
| Panel | Where it comes from | What the app has to provide |
|---|---|---|
| Requests, 5xx share, response time | Dokku’s nginx access log, parsed in Loki (health-check requests filtered out) | Nothing |
| CPU and memory by process | cAdvisor, grouped by Dokku’s web / worker labels |
Nothing |
| Logs | Container output, shipped to Loki | Nothing |
| Health check, certificate expiry | blackbox-exporter requesting https://<domain>/healthz |
A /healthz route that returns 200 |
| App metrics (optional) | Prometheus scraping the container | A metrics endpoint on the observability network |
The first three work for any app. The health check is the one assumption: an app without a /healthz route shows as failing even while it serves real users perfectly well.
Nobody maintains the health check list by hand. On every run, the role asks Dokku for its apps and each app’s domains, and Ansible writes them to a target file that Prometheus watches. Adding an app means re-running the role, and there’s no list to forget to update. Because the probe is a real HTTPS request to the real domain, it also reports when the certificate expires, which is the only way I’d find out that Let’s Encrypt renewals had stopped before a browser did.
Apps that expose their own Prometheus metrics opt in with a container label and nothing else:
dokku docker-options:add myapp deploy "--label observability.metrics.port=9000"
dokku network:set myapp attach-post-deploy observability
dokku ps:rebuild myapp
Prometheus finds them through the Docker socket and scrapes them on the observability network. The one thing not to do is dokku ports:add for the metrics port, which tells Dokku’s nginx to proxy it, publicly.
Logs you can query without drowning Loki
Dokku’s nginx writes plain-text access logs. The role defines a JSON format and sets it as Dokku’s global default, so every app’s access log becomes one JSON object per request:
log_format dokku_json escape=json '{"time":"$time_iso8601","host":"$host","remote_addr":"$remote_addr","method":"$request_method","path":"$uri","status":$status,"bytes":$body_bytes_sent,"request_time":$request_time,"upstream_time":"$upstream_response_time","user_agent":"$http_user_agent"}';
Two small choices in that line matter. path is $uri, not $request_uri, so query strings, which often carry tokens, stay out of the access log’s path field. (Other sources, such as an app’s own log output, can still record them.) And status and request_time are unquoted numbers, so queries can compare and average them directly.
The bigger choice is what not to turn into labels. In Loki, each distinct combination of label values is a separate stream, so labelling by path or IP would multiply the streams and blow up its index. Labels stay at a few values that barely change (job, app, container, the Dokku process type and the output stream), and everything else is parsed when you query:
{job="nginx", app="myapp"} | json | status >= 500
That’s enough for the Apps dashboard’s request rate, error share and p95 response time to come straight from nginx, with no instrumentation in the app at all.
Grafana is just another Dokku app (almost)
Deploying Grafana through Dokku from Ansible meant driving an imperative CLI one setting at a time: read the current value, change it only if it differs. Grafana runs from a pinned image with git:from-image, keeps its database on a storage mount, and reads its datasources and dashboards from a read-only mount of the repo. The provisioned dashboards are managed in Git and can’t be edited in the UI, though nothing stops you creating other dashboards alongside them.
Two Dokku behaviours decided the order of the steps.
domains:set clears the port mapping on an app that hasn’t been deployed yet. Set the port and then the domain, and a fresh Grafana comes up with no port mapping. The domain goes first.
ports:set replaces the whole list. letsencrypt:enable adds an HTTPS mapping, and a later ports:set http:80:3000 would quietly delete it. The role only ever uses ports:add.
The fail2ban jail that watched nothing
Grafana locks an account after five bad passwords, which protects the account but not the server. So there’s also a fail2ban jail that reads Grafana’s JSON access log and bans an address after five failed logins in ten minutes:
[grafana]
enabled  = true
backend  = auto
logpath  = /var/log/nginx/grafana-access.log
maxretry = 5
findtime = 10m
bantime  = 1h
Without backend = auto, the jail starts, reports itself as active, and never bans anyone. On Ubuntu 24.04, fail2ban’s default backend is systemd, which reads the journal and ignores logpath entirely. nginx writes to a file, so the jail was watching nothing. The tell is fail2ban-client status grafana showing zero failures right after you deliberately type a wrong password.
Two dashboard panels that lied
These are my favourite bugs from the project, because both panels looked completely reasonable.
“Root disk full in” predicted a full disk that wasn’t coming. The first Server dashboard had a tile that projected when the disk would fill, from how fast free space had fallen over six hours:
(node_filesystem_avail_bytes{mountpoint="/"} / -deriv(node_filesystem_avail_bytes{mountpoint="/"}[6h])) > 0
On a Dokku host, every deploy pulls images and builds layers, so free space drops sharply for a few minutes. A straight line through six hours of that projects the dip forward forever, and a mostly empty disk read as days from full. Disk use on a deploy server moves in steps, not trends. The tile now just shows free space: 81.7 GiB in the screenshot, which is the number I actually act on.
Every container kept its temporary name for life. Dokku starts a new container as something like myapp.web.1.upcoming-12345, checks it’s healthy, then renames it. cAdvisor records the name the first time it sees a container and never updates it, so the “top containers” panels showed .upcoming names for containers that had been running for days. The fix is to stop trusting the name and build one from Dokku’s labels, which never change:
sort_desc(topk(8, sum by (name) (
  label_replace(
    label_join(
      container_memory_working_set_bytes{name!=""},
      "dokku", ".", "container_label_com_dokku_app_name", "container_label_com_dokku_process_type"),
    "name", "$1", "dokku", "(.+[.].+)")
)))
label_join builds app.process, and label_replace only uses it when both halves exist, so the Compose containers keep their own names. That’s why the screenshot shows grafana.web and jobtracker.worker next to observability-loki-1.
Running it yourself
This assumes the host was set up with the bootstrap playbook; the role isn’t a standalone installer for an arbitrary Dokku server. Point a DNS record at the server and add three settings:
# group_vars/all.yml
observability_grafana_domain: monitoring.example.com
observability_grafana_admin_password: "..."     # 16+ characters; vault it
dokku_letsencrypt_email: you@example.com
ansible-playbook site.yml --tags dokku,observability --ask-vault-pass
The dokku tag is needed too: it’s the role that applies the Let’s Encrypt email Grafana’s certificate depends on.
The dashboards now tell me when something is wrong, but only if I’m looking at them. The next step is alerting that pages me when the health check fails or a certificate stops renewing, and that’s a post of its own.