Ask a Python app running four worker processes how many requests it has served, and the answer depends on which worker you happen to ask.
That’s what a plain scrape does to it. Prometheus requests /metrics, the app server hands the request to whichever worker picks it up, and that worker reports its own counters, not the app’s. Prometheus sees a counter that jumps up and down, and reads every drop as a restart.
That was the gap left in my Dokku monitoring. The previous post covered what the server can see from the outside: host metrics, container CPU and memory, nginx access logs, health checks. It could tell me an app was slow, but not which database query or outbound API call made it slow. And its one path for app metrics, a scrape port per container, is the one that breaks with multiple workers.
So the apps now push OpenTelemetry traces and metrics instead. Traces go to Grafana Tempo, metrics go to the same Prometheus, and a log line with a trace ID links to its trace. It’s all deployed by the same Ansible playbook, and nothing new is published on the host.
This is what that looks like, for one run of a scheduled background job in one of my apps:
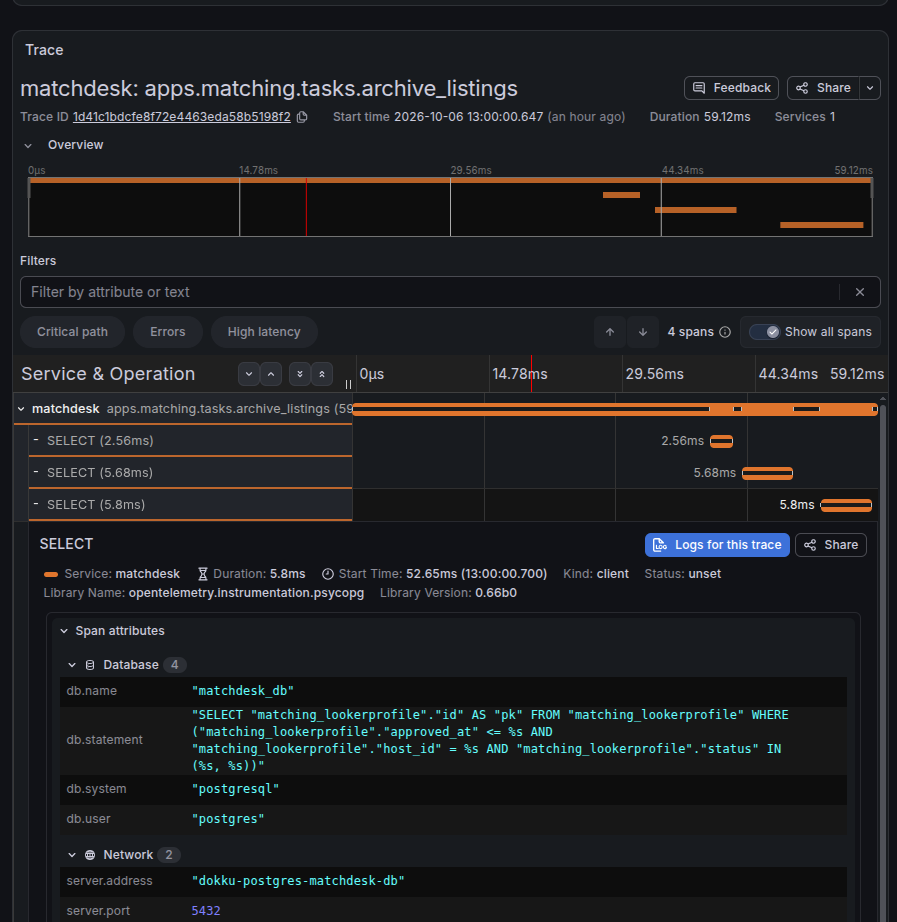
The whole run took 59 ms. Its three database queries, recorded automatically by the Postgres driver’s instrumentation, account for about 14 ms of that, and the first one doesn’t start until roughly 40 ms in. The dashboards from the last post could never have told me that. This one trace also shows the limit of tracing: it only sees what’s instrumented, so those first 40 ms are a blank bar until I add spans of my own.
A normal /metrics scrape breaks with multiple processes
The previous post let an app opt into metrics with a container label, and Prometheus scraped its /metrics port. That’s fine for one process. Most Python web apps aren’t one: the app server runs several workers, and a background job runner runs alongside them. Each process keeps its own registry, so the scrape’s answer depends on which worker handled it.
The Python Prometheus client has a fix, multiprocess mode, where every worker writes its metrics to files in a shared directory and one endpoint adds them up. It works, but it changes how metrics are defined (gauges need a rule for how to combine), some metric types such as Info and Enum don’t work at all, and the directory has to be wiped between restarts.
The alternative is to turn the flow around. Instead of Prometheus pulling from each app, each process pushes its own metrics over OTLP, the OpenTelemetry protocol. Three things made that the better trade here:
- Each process reports for itself. Nothing has to aggregate across workers inside the app.
- There’s no port to expose. The previous post warned against
dokku ports:addon a metrics port, because Dokku’s nginx would make it public. With push, there’s no port to get wrong. - One SDK does traces and metrics. The OpenTelemetry SDK that pushes metrics also produces traces, to the same endpoint, with the same configuration.
The scrape path is still in the playbook for apps that already have one. New instrumentation pushes.
One receiver, on a network nothing else can reach
The monitoring stack already had Grafana Alloy shipping logs. Alloy can also receive OTLP, so it became the single place apps send telemetry:
app ──OTLP──▶ Alloy (alloy:4317 gRPC, alloy:4318 HTTP)
                ├── traces  ─▶ Tempo
                └── metrics ─▶ Prometheus (OTLP receiver)
The receiver and its batching step:
otelcol.receiver.otlp "apps" {
  grpc {
    endpoint = "0.0.0.0:4317"
  }

  http {
    endpoint = "0.0.0.0:4318"
  }

  output {
    metrics = [otelcol.processor.transform.app_label.input]
    traces  = [otelcol.processor.batch.default.input]
  }
}

otelcol.processor.batch "default" {
  output {
    metrics = [otelcol.exporter.otlphttp.prometheus.input]
    traces  = [otelcol.exporter.otlp.tempo.input]
  }
}
Prometheus 3 accepts OTLP directly once it’s started with --web.enable-otlp-receiver, so metrics don’t need a separate gateway. Tempo is the one new service in the Compose project, with local disk storage and seven days of retention.
The OTLP ports listen only on the observability Docker network. Apps join it with network:set ... attach-post-create, not the attach-post-deploy that scraping used: post-deploy skips one-off dokku run containers, and those send telemetry now too. Nothing is published on the host and ufw needs no new rule. It’s the same trust boundary as before: any app on that network can send telemetry, and every app on this server is mine.
Making pushed metrics look like scraped ones
Every dashboard on this server filters on an app label, taken from Dokku’s container labels: the logs, the nginx panels, the container panels, the app dropdown. Pushed metrics don’t come from a container Prometheus looks at, so they arrive with whatever the SDK sends. Prometheus gives service.name and service.instance.id special treatment when translating OTLP metrics, mapping them into the identifying job and instance labels. Other resource attributes aren’t labels on every metric by default; they live on target_info unless explicitly promoted. No app label, so none of the dashboards would ever show them.
Two small pieces of configuration close that gap. Alloy copies service.name into an app attribute on the way through:
otelcol.processor.transform "app_label" {
  error_mode = "ignore"

  metric_statements {
    context    = "resource"
    statements = [`set(resource.attributes["app"], resource.attributes["service.name"])`]
  }

  output {
    metrics = [otelcol.processor.batch.default.input]
  }
}
and Prometheus promotes it, plus two others, to labels on every series:
otlp:
  promote_resource_attributes: [app, process_type, deployment.environment]
The contract for an app is then one environment variable: set OTEL_SERVICE_NAME to the Dokku app name, and its pushed metrics carry the same app label as its logs, its container metrics and its health check.
Prometheus drops out-of-order samples
Scraped samples arrive in order, because Prometheus decides when to collect them. Pushed samples can arrive out of order after batching, retries, or multiple telemetry producers. By default, Prometheus rejects an out-of-order sample once a newer sample for that series has already been ingested.
The fix is one setting that gives the database a window to accept them:
storage:
  tsdb:
    out_of_order_time_window: 30m
It’s easy to miss, because the rejections only show up in Alloy’s and Prometheus’s own logs. On the dashboards, they’re just gaps.
Four workers, one series
Pushing solves the four-workers problem only if Prometheus can tell the workers apart, and the label that does that is instance, from service.instance.id. Leave it unset and every worker of an app writes to the same series. Say worker one reports 1,200 requests and worker two reports 900 a second later: Prometheus stores both as consecutive samples of one counter, which looks like a reset. It’s the scrape problem again, arriving by a different route.
OTEL_SERVICE_NAME can’t fix this, because Dokku config applies to every process of an app. So two resource attributes are set in the app’s code, at startup:
service.instance.id: unique per process, for example the hostname plus the PID.process_type:web,worker, orcommandfor one-off management commands, so the dashboards can split them the way they already do for container metrics.
In the Django app from the trace above, trimmed down, that’s one function:
import os
import socket

from opentelemetry import metrics, trace
from opentelemetry.exporter.otlp.proto.http.metric_exporter import OTLPMetricExporter
from opentelemetry.exporter.otlp.proto.http.trace_exporter import OTLPSpanExporter
from opentelemetry.instrumentation.django import DjangoInstrumentor
from opentelemetry.instrumentation.httpx import HTTPXClientInstrumentor
from opentelemetry.instrumentation.psycopg import PsycopgInstrumentor
from opentelemetry.sdk.metrics import MeterProvider
from opentelemetry.sdk.metrics.export import PeriodicExportingMetricReader
from opentelemetry.sdk.resources import Resource
from opentelemetry.sdk.trace import TracerProvider
from opentelemetry.sdk.trace.export import BatchSpanProcessor


def configure(process_type):
    # Unset in local dev and tests, so nothing tries to reach Alloy
    if not os.environ.get("OTEL_EXPORTER_OTLP_ENDPOINT"):
        return
    # service.name and deployment.environment come from the OTEL_* environment variables
    resource = Resource.create({
        "service.instance.id": f"{socket.gethostname()}-{os.getpid()}",
        "process_type": process_type,
    })

    tracer_provider = TracerProvider(resource=resource)
    tracer_provider.add_span_processor(BatchSpanProcessor(OTLPSpanExporter(timeout=5)))
    trace.set_tracer_provider(tracer_provider)

    reader = PeriodicExportingMetricReader(OTLPMetricExporter(timeout=5))
    metrics.set_meter_provider(MeterProvider(resource=resource, metric_readers=[reader]))

    DjangoInstrumentor().instrument()
    PsycopgInstrumentor().instrument()
    HTTPXClientInstrumentor().instrument()
The three instrumentors are what produce spans: one per request, database query and outbound HTTP call. The job runner has no instrumentation of its own, so a small task middleware opens a span per job, named after the task. That’s the root span in the trace at the top. The full version also adds a sampler that drops queries made outside any request or job, such as the worker polling its queue. Without it, every poll becomes a trace of its own.
Call configure once in each process, after any fork. The exporters run background threads, and a thread started before a fork doesn’t exist in the child. Under gunicorn, wsgi.py is the place: each worker imports it after the fork, as long as gunicorn runs without --preload. It also has to run before get_wsgi_application(), because the Django instrumentation works by adding a middleware:
os.environ.setdefault("DJANGO_SETTINGS_MODULE", "config.settings")
telemetry.configure("web")
application = get_wsgi_application()
manage.py covers every other process: it calls configure("worker") before starting the job runner, and configure("command") for anything else, with the command wrapped in a span of its own.
From a log line to its trace, and back
Traces are most useful when you don’t have to go looking for them. Logs stay on stdout and still go to Loki the way they did before. If an app writes trace_id as a field in its JSON log lines, Grafana’s Loki datasource turns it into a link:
derivedFields:
  - name: trace_id
    matcherRegex: '"trace_id":\s*"(\w+)"'
    datasourceUid: tempo
    urlDisplayLabel: View trace
The Tempo datasource links the other way. From any span, Grafana opens that app’s logs within five minutes either side, filtered on the trace ID, by mapping the trace’s service.name to the app label in Loki:
tracesToLogsV2:
  datasourceUid: loki
  spanStartTimeShift: -5m
  spanEndTimeShift: 5m
  filterByTraceID: true
  tags:
    - key: service.name
      value: app
Both directions depend on the same convention as the metrics: the service name is the Dokku app name. One name joins all three signals.
One detail to watch: setting the SDK up in code, as above, exports only traces and metrics, but the zero-code opentelemetry-instrument wrapper reads OTEL_LOGS_EXPORTER and can send logs over OTLP too. This pipeline has no logs output, so if you use the wrapper, set OTEL_LOGS_EXPORTER=none and keep logs on stdout, where Dokku and Loki already handle them.
Running it yourself
On a host set up with the bootstrap playbook, re-run the observability role, then point an app at Alloy:
ansible-playbook site.yml --tags observability

dokku network:set myapp attach-post-create observability
dokku config:set myapp \
  OTEL_EXPORTER_OTLP_ENDPOINT=http://alloy:4318 \
  OTEL_SERVICE_NAME=myapp \
  OTEL_RESOURCE_ATTRIBUTES=deployment.environment=production
To check the pipeline before touching an app, send a test trace and metric with the OpenTelemetry Collector’s telemetrygen and look for them in Tempo and Prometheus:
tg=ghcr.io/open-telemetry/opentelemetry-collector-contrib/telemetrygen
docker run --rm --network observability $tg traces --traces 1 --otlp-http --otlp-endpoint alloy:4318 --otlp-insecure --service otlptest
docker run --rm --network observability $tg metrics --metrics 1 --otlp-http --otlp-endpoint alloy:4318 --otlp-insecure --service otlptest
docker run --rm --network observability curlimages/curl -s -G http://tempo:3200/api/search --data-urlencode 'q={}'
docker run --rm --network observability curlimages/curl -s -G http://prometheus:9090/api/v1/series --data-urlencode 'match[]={app="otlptest"}'
If the last command returns series labelled app="otlptest", the label mapping works end to end.
This adds one more service to a monitoring stack that, as the last post showed, already outweighs the apps it watches, and Tempo 3 logs the occasional harmless error when it’s idle. In return, the trace above came with a question I couldn’t have asked before: what that job does for 40 ms before its first query. The next thing I want is alerting that uses all three signals: a failing health check, a spike in 5xx, and the slow trace that explains it. That’s a post of its own.